Gold-bearing quartz vein mineralization orogenic type deposit
Overview
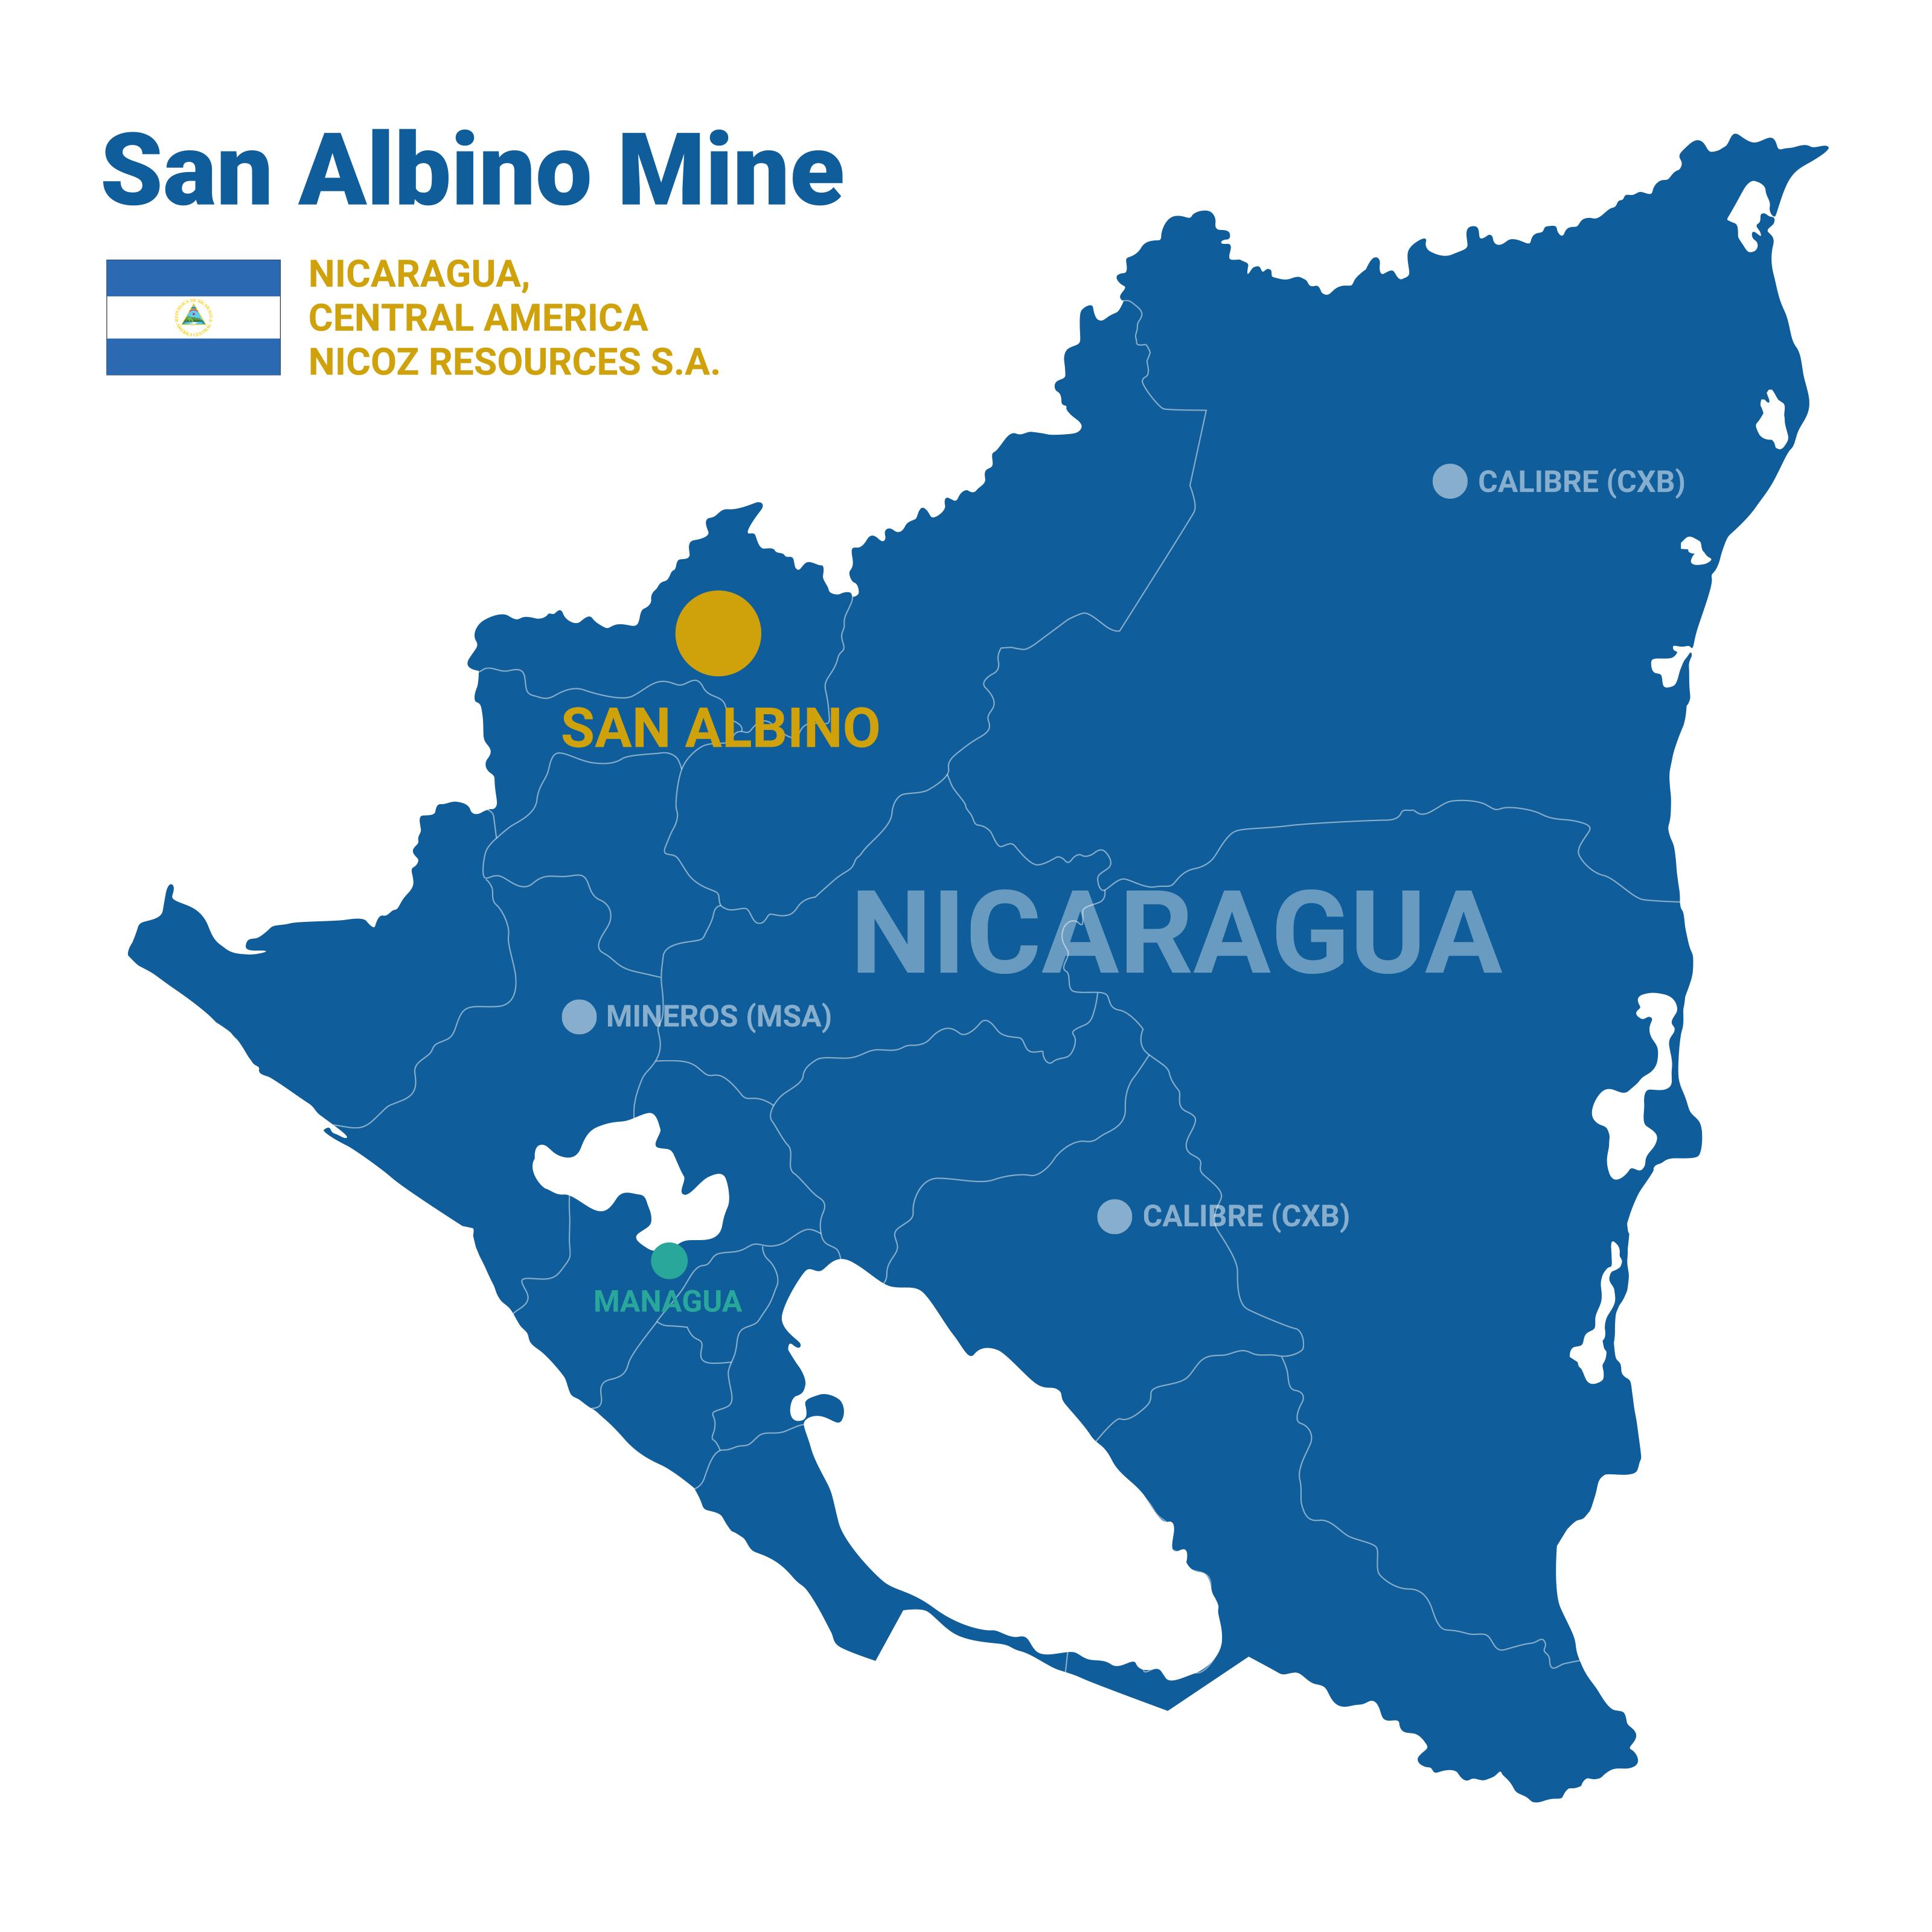
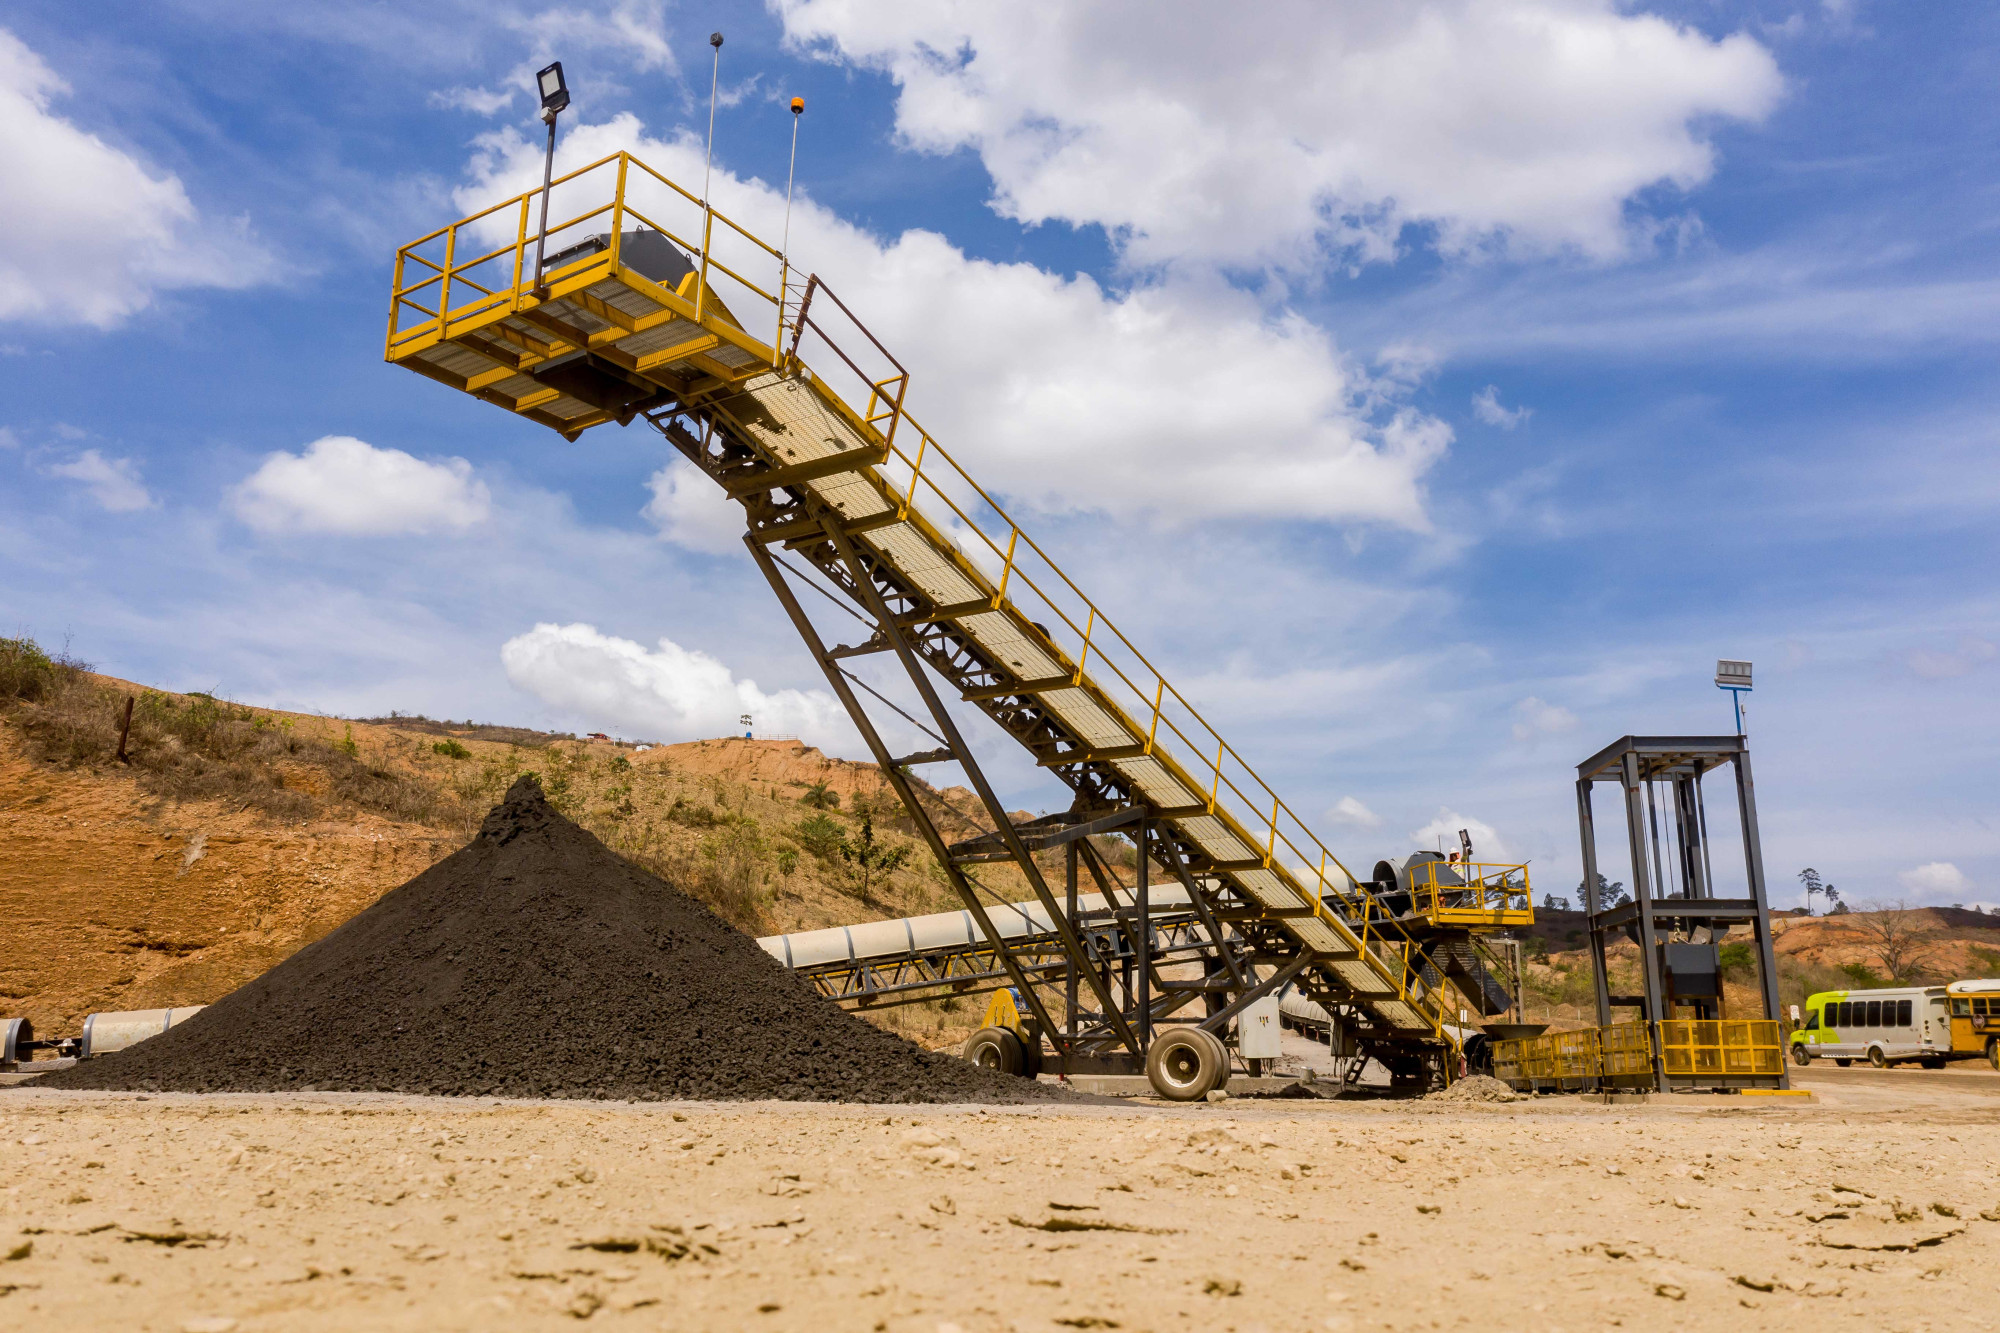
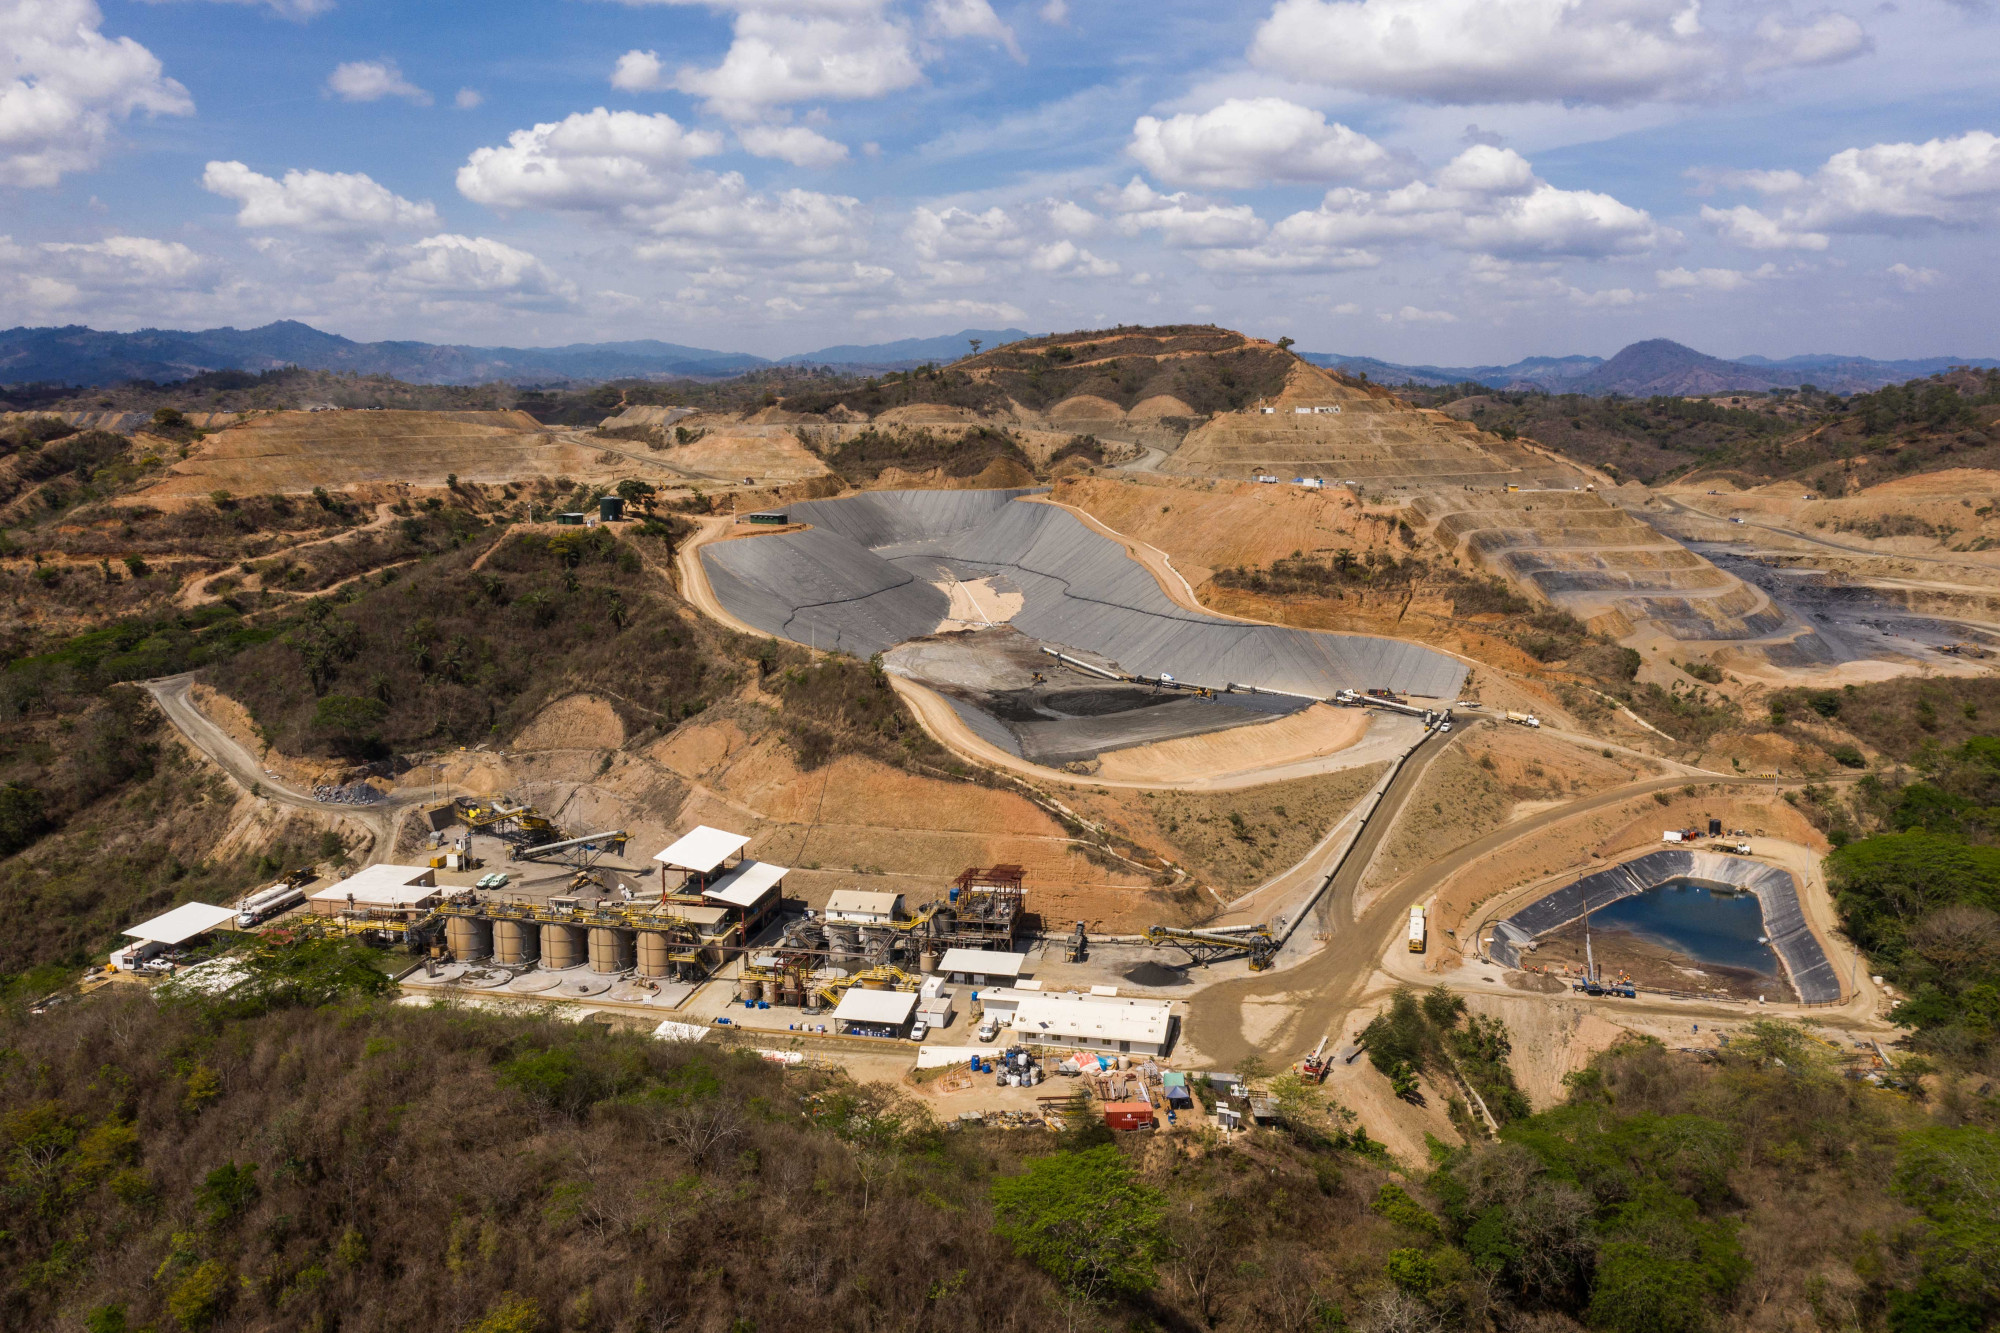
The San Albino Mine, located in the Nueva Segovia Department of Nicaragua approximately 227 km north of Managua and near the Honduran border, is a fully permitted and operating gold mining project owned and operated by Mako Mining Corp. through its subsidiaries. The operation centers on the high-grade San Albino deposit, with additional near-mine potential at Las Conchitas, and is supported by a consolidated land package of four contiguous concessions totaling ~18,817 hectares, all 100% controlled by Mako. San Albino represents a strategically valuable, cash-flow-generating asset with near-term expansion upside in a historically productive gold district.
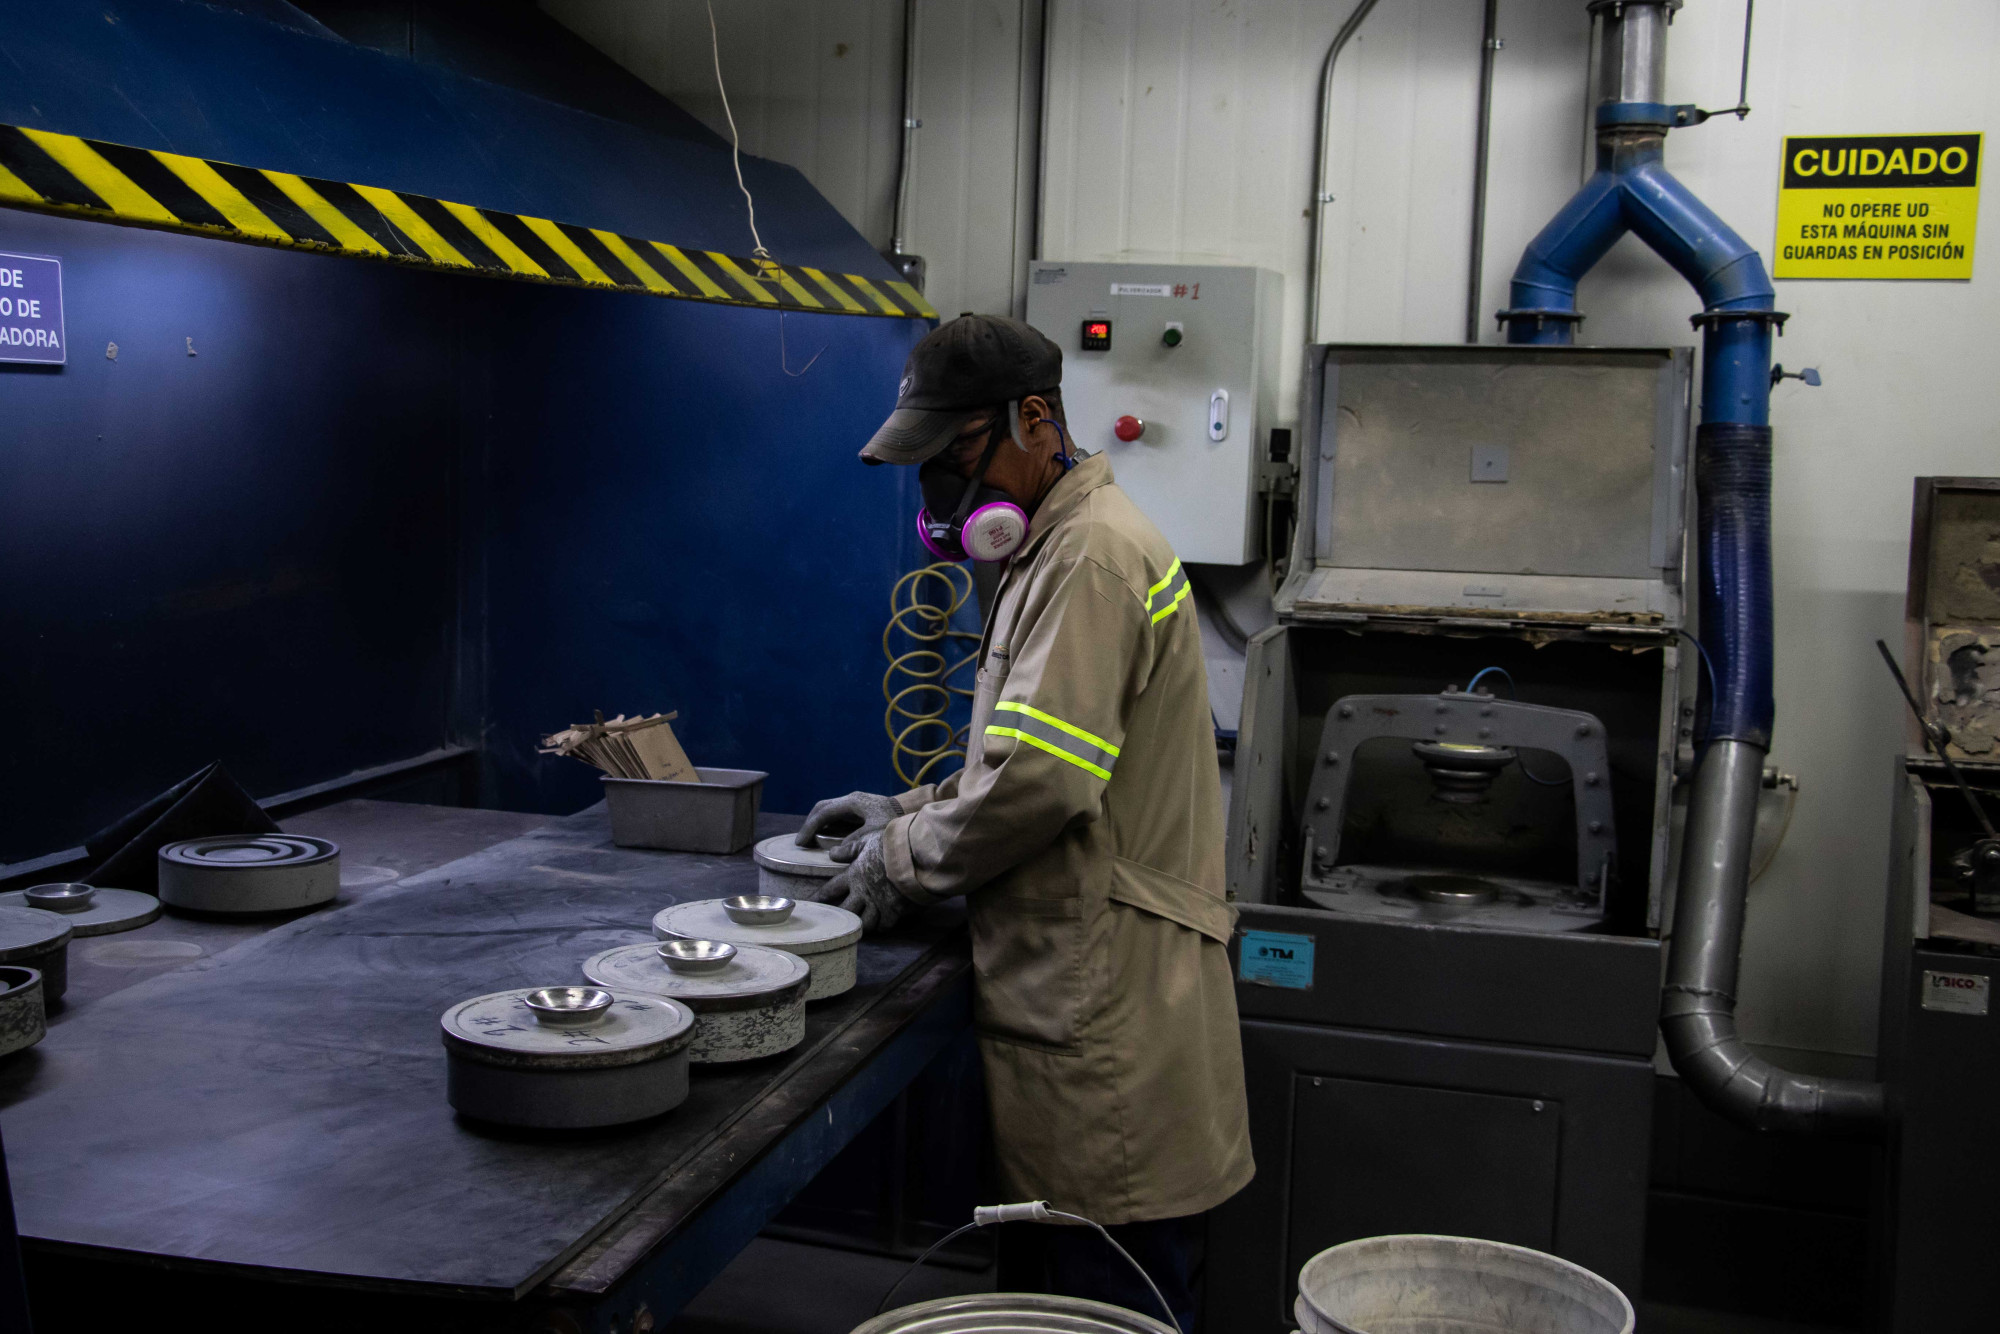
Processing and Other Key Metrics
Plant Type
Miling Plan/Gravity + CIL Recovery
Plant Capacity
500 tpd (with capacity to expand 1000tpd)
Avg. Grade Fed To Mill
7.0 g/t (2)
Au Recovery
80% (2)
Avg. Annual Productoin Au
~37K oz Au (2)
(2) Average Operating Results Obtained from 2022-2025
Resources
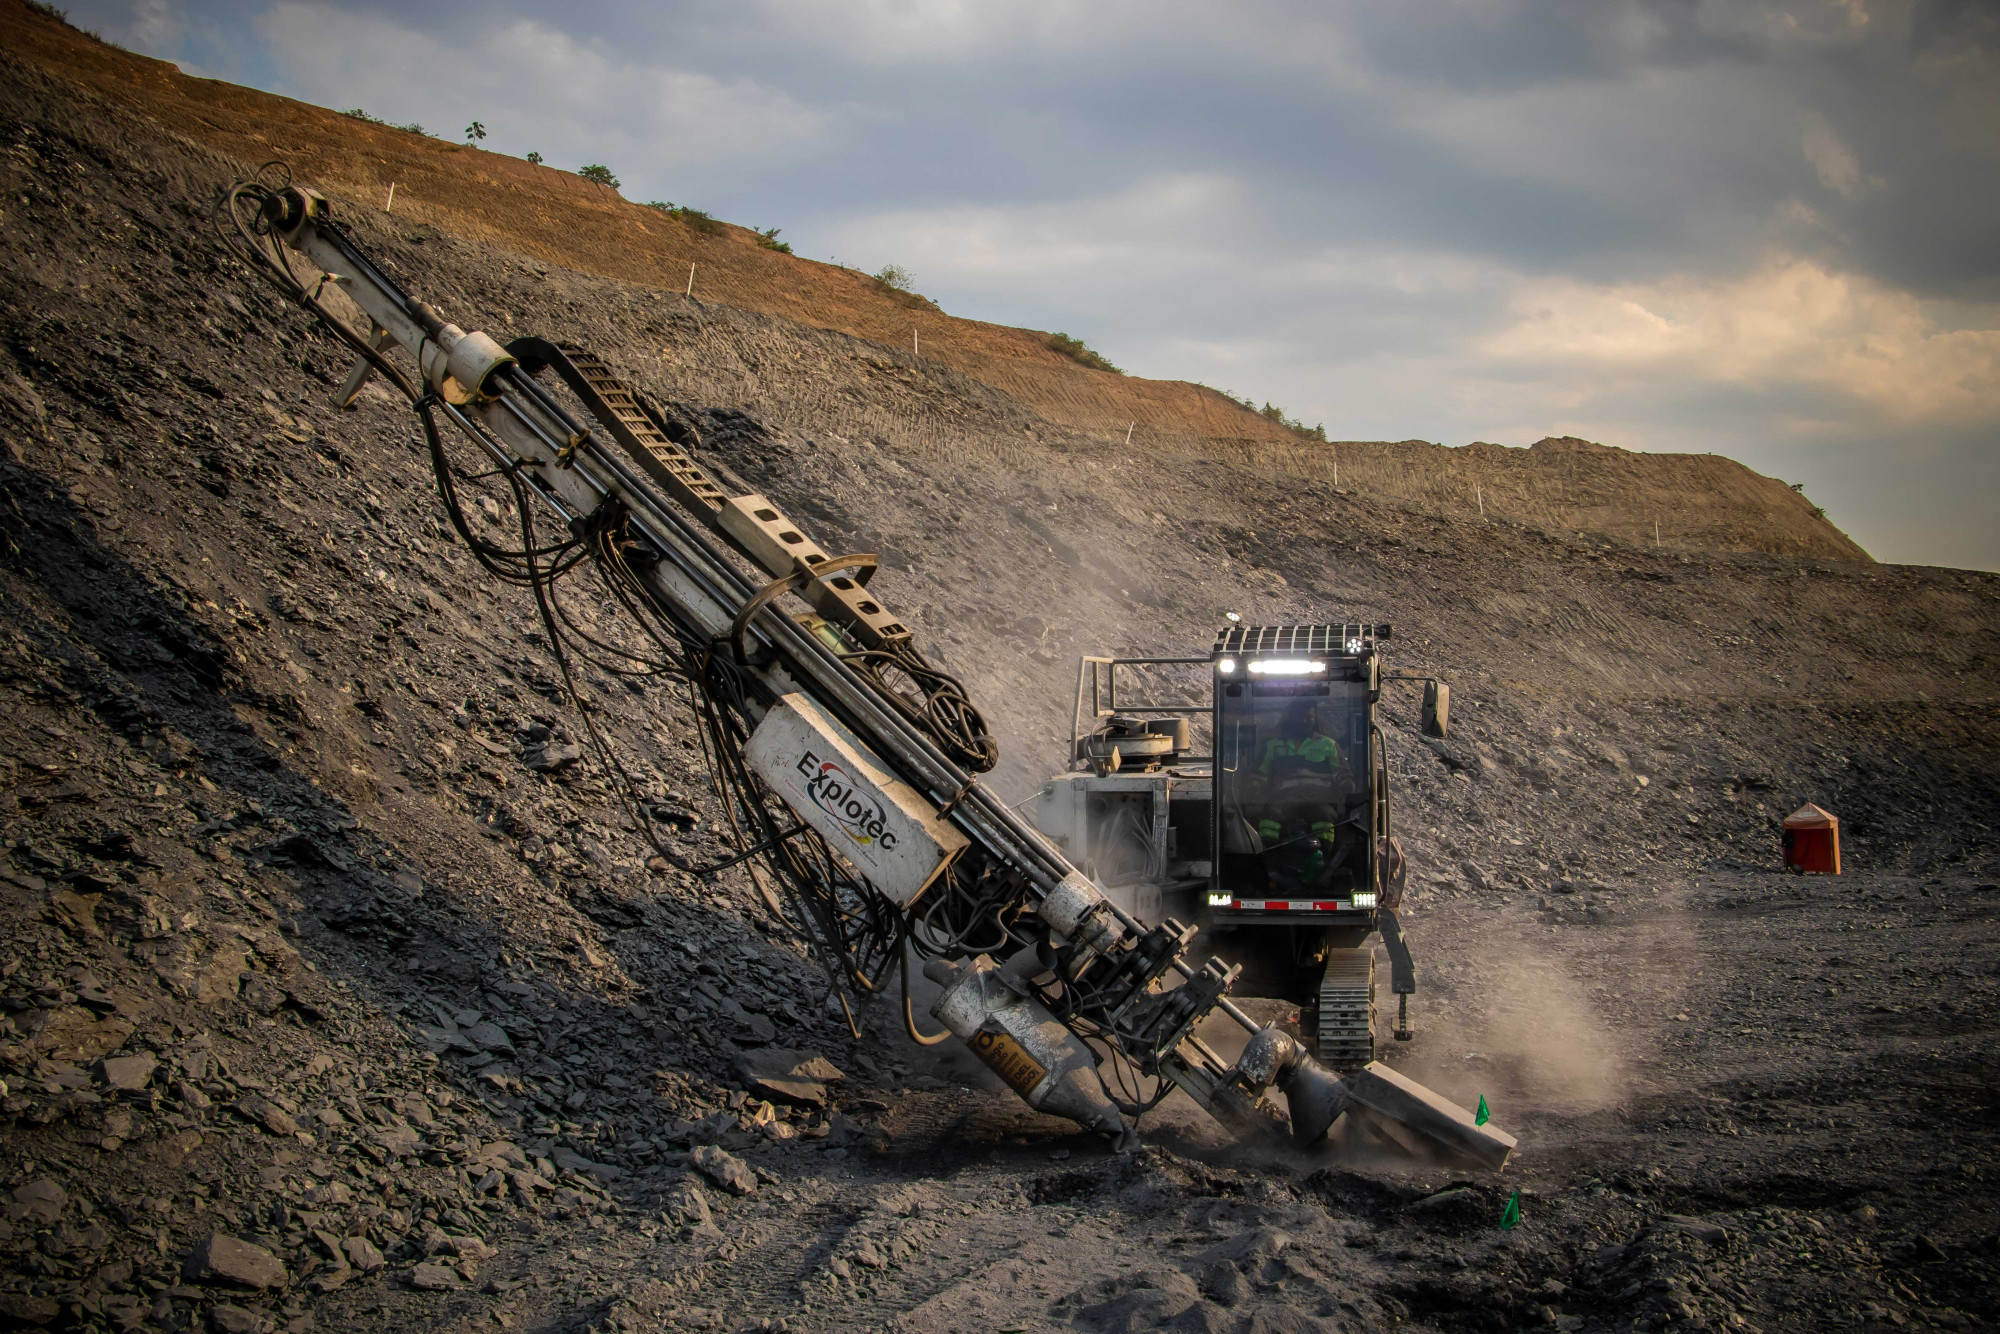
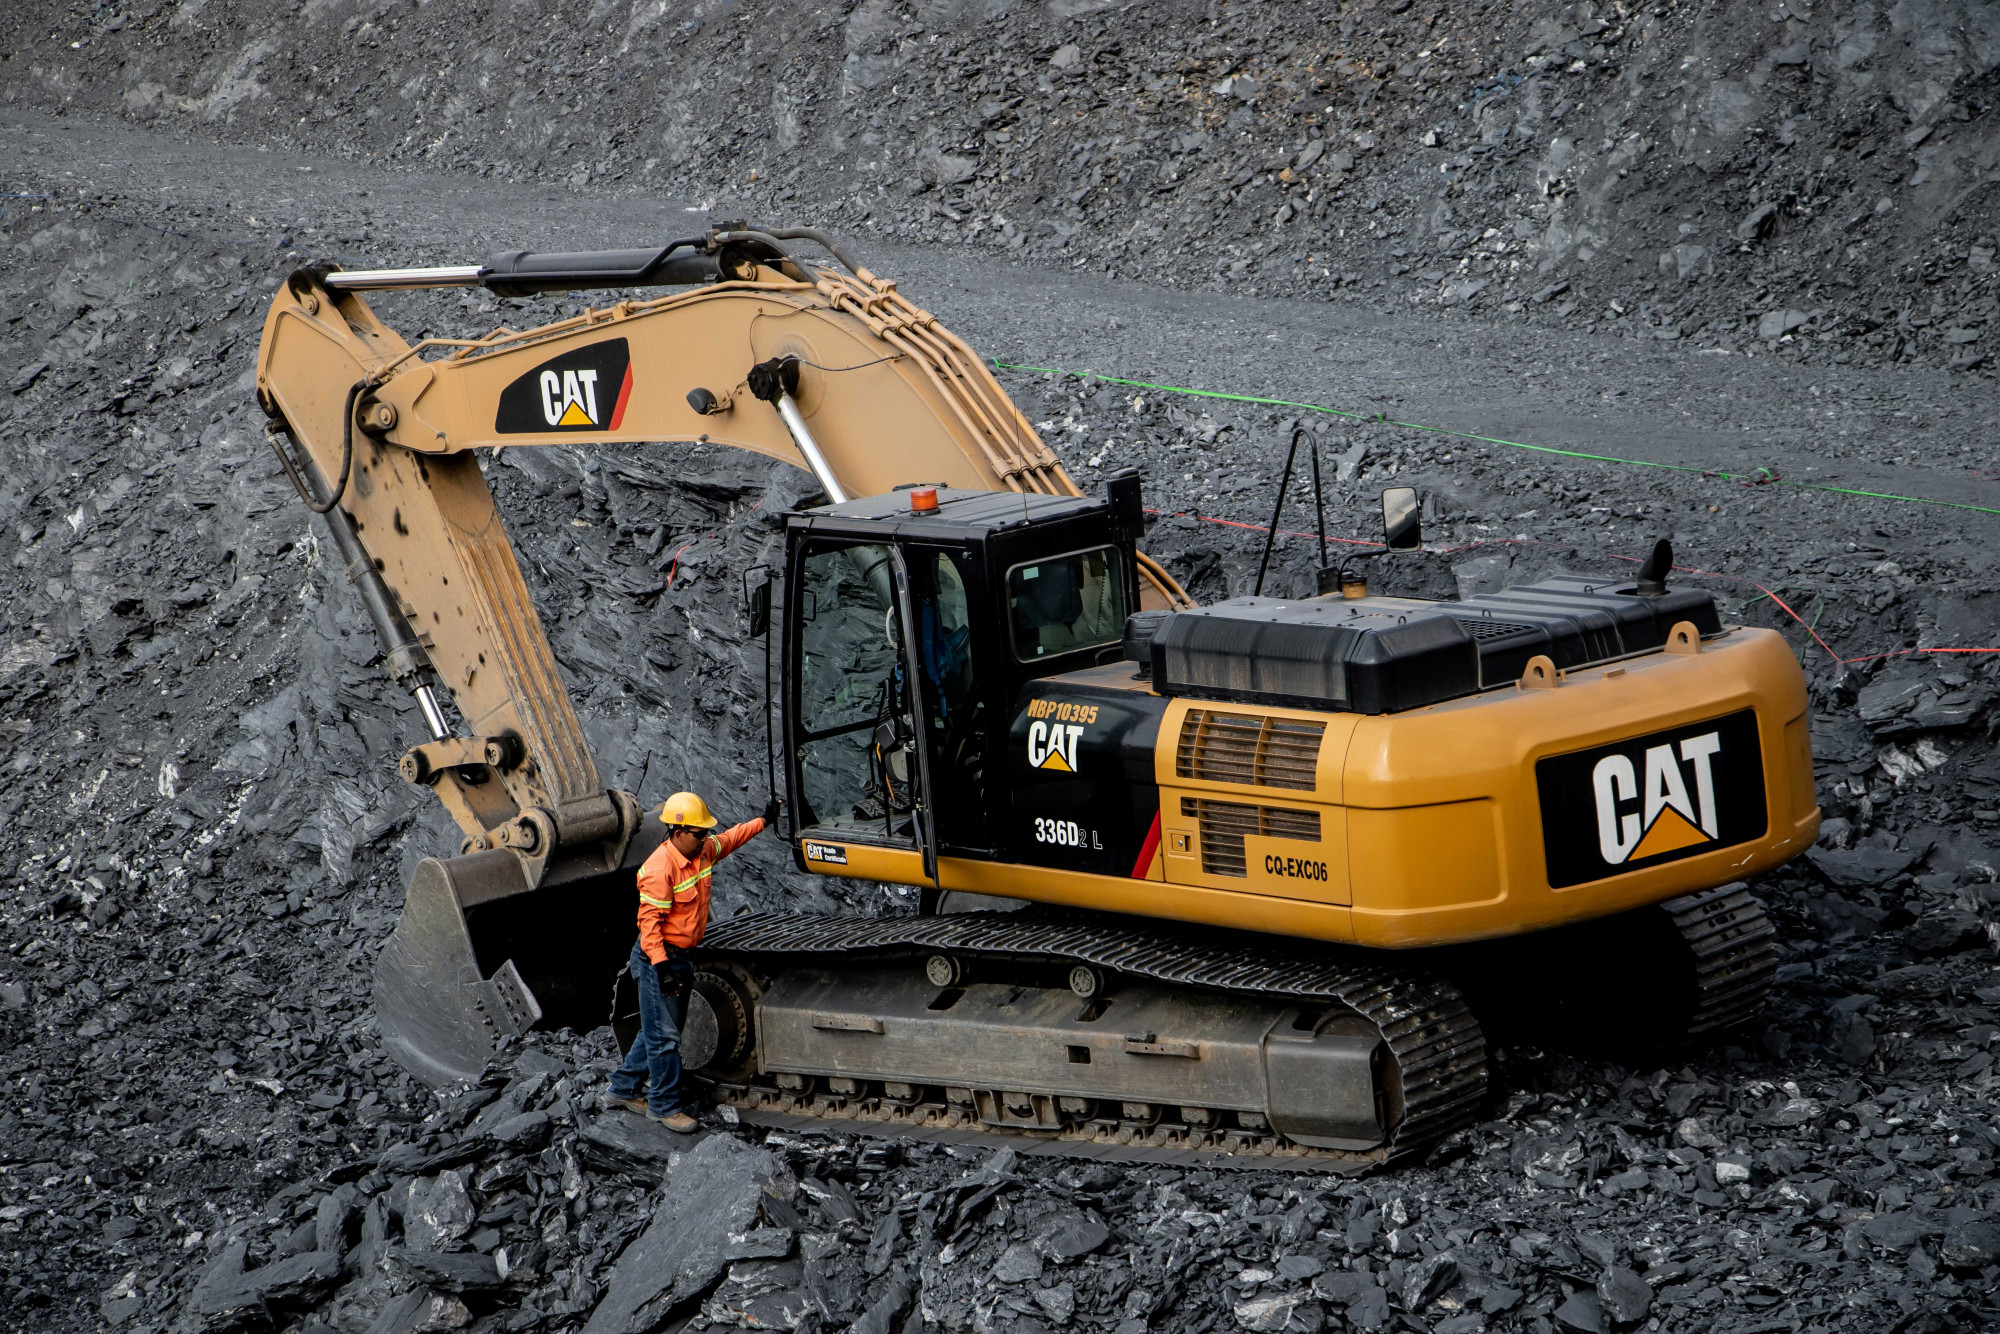
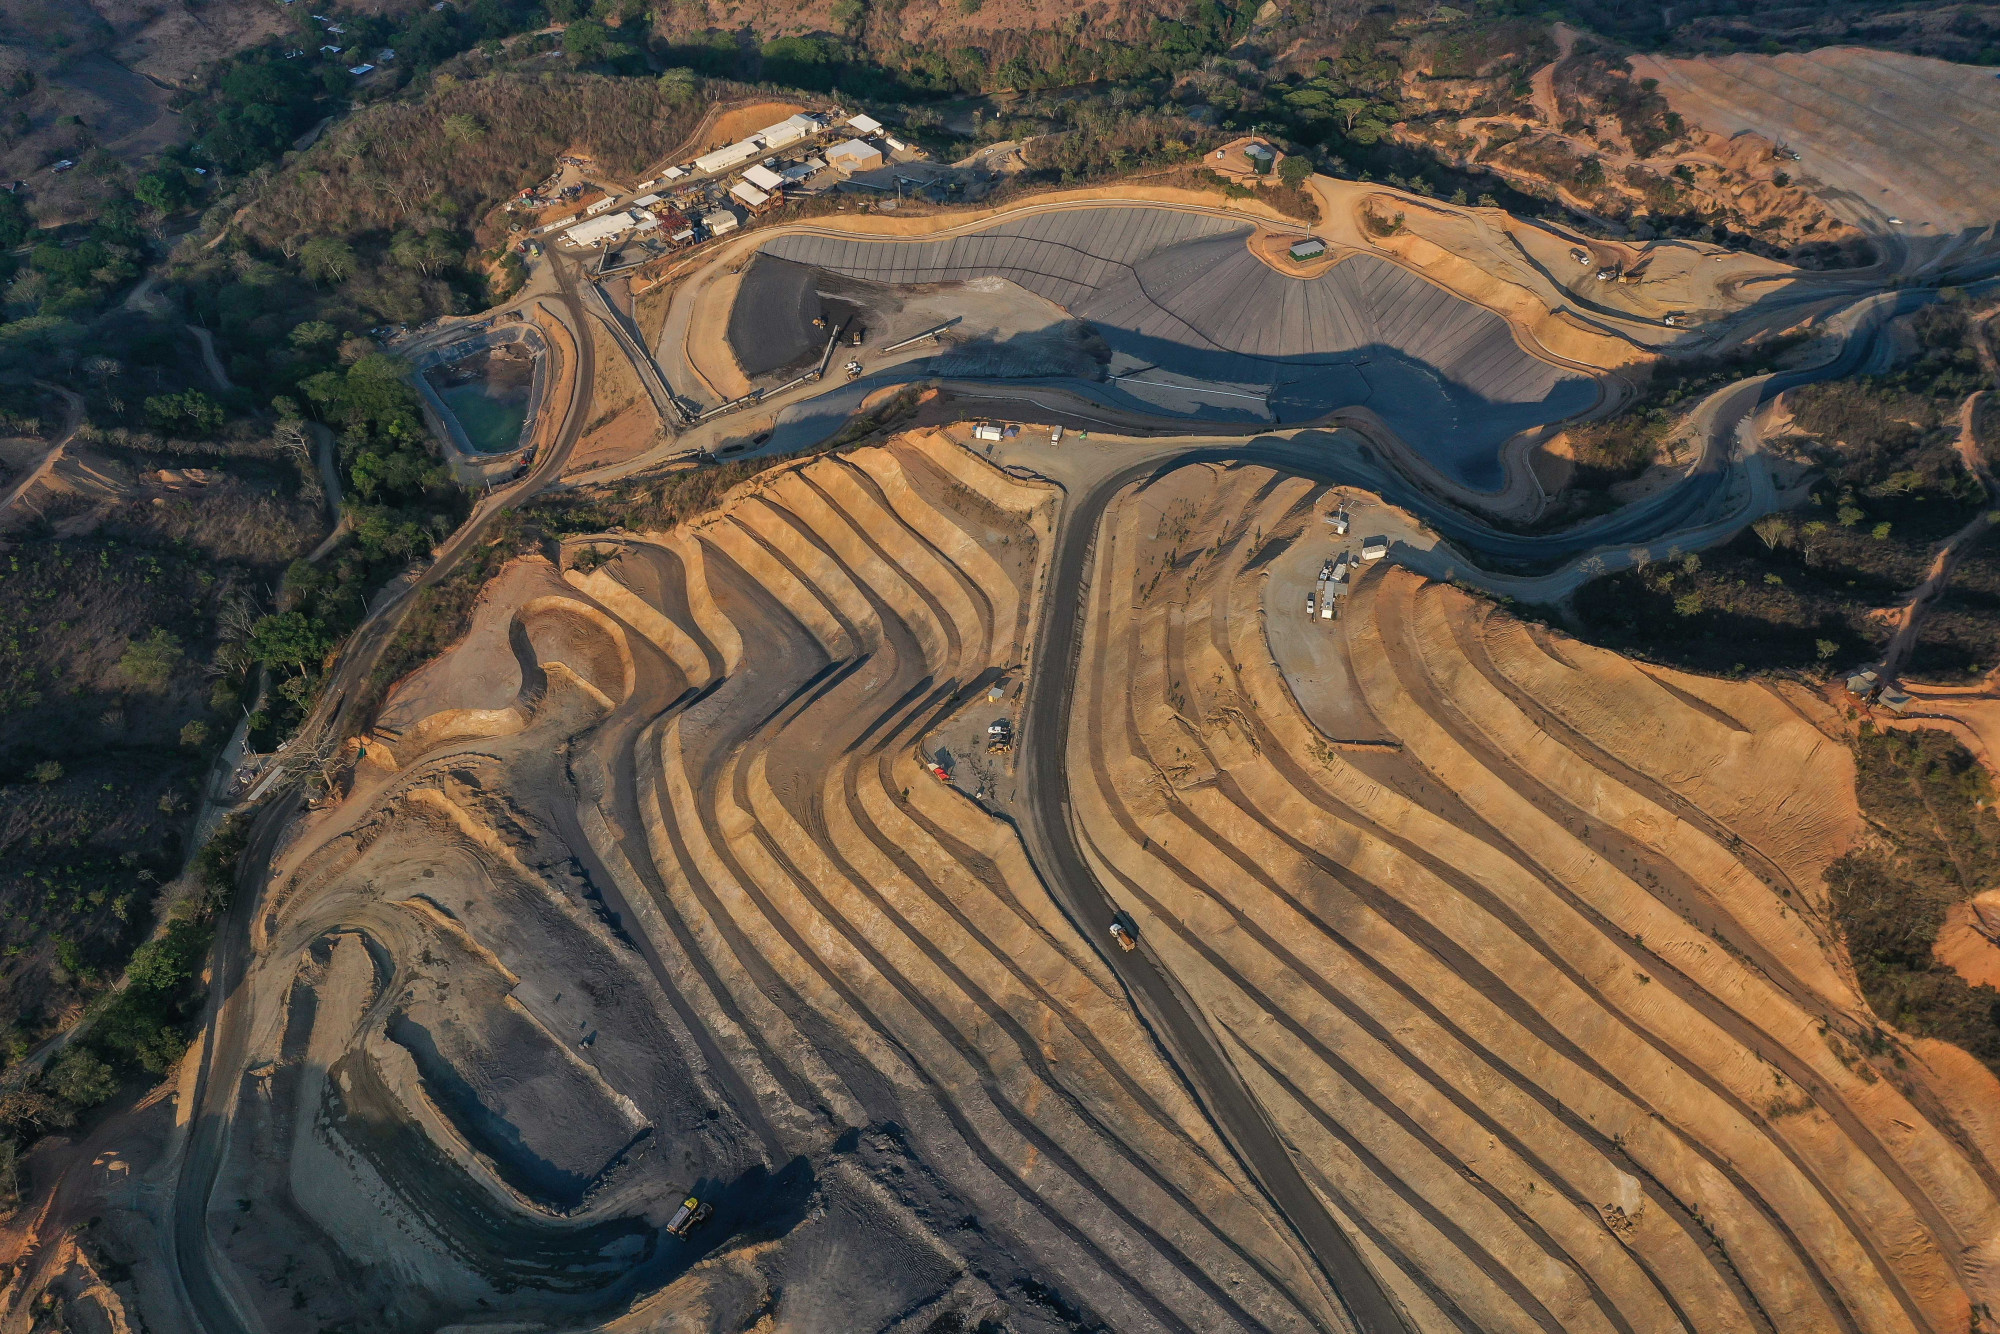
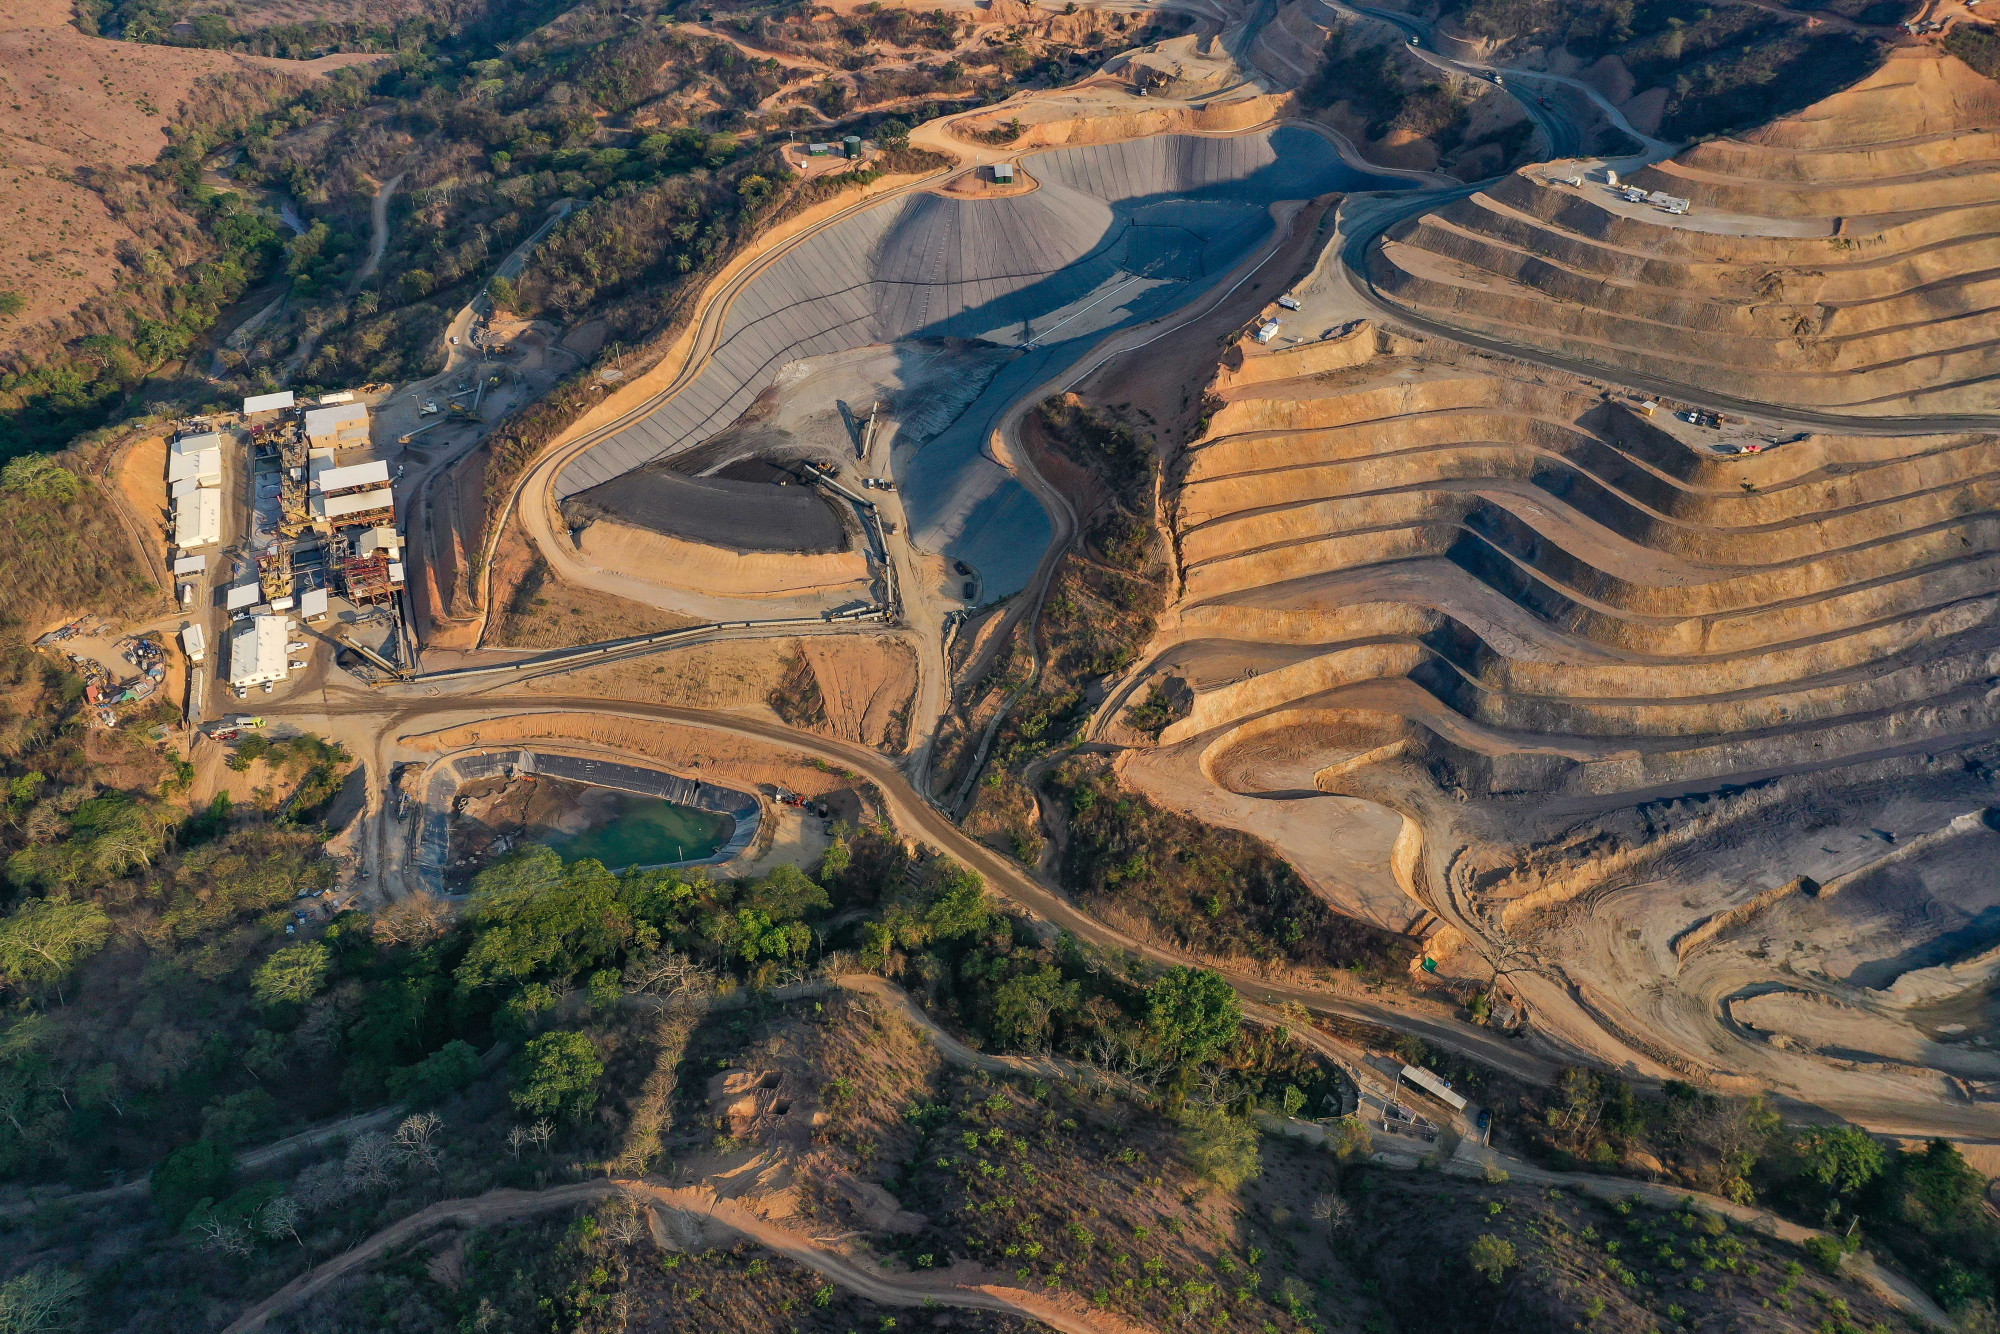
San Albino Project: Open Pit and Underground Dumps
I agree to and consent to receive news, updates, and other communications by way of commercial electronic messages (including email) from Mako Mining Corp. I understand I may withdraw consent at any time by clicking the unsubscribe link contained in all emails from Mako Mining Corp.
Mako Mining Corp.
838 West Hastings St.
Suite 700
Vancouver, BC V6C 0A6 info@makominingcorp.com